
Measuring web performance
The first step towards achieving good web performance is to measure the performance of the site. You can make use of these great tools to measure and understand the performance of the site.
- https://developers.google.com/speed/pagespeed/insights/
- https://www.webpagetest.org/
- https://gtmetrix.com/
- https://developers.google.com/web/tools/lighthouse
- https://www.debugbear.com/
The developers can add this web-vitals library to the webpage while developing the site and check the console. You can add the following code at the end of the page. You will not need this script on production, so be sure to remove it from the production environment.
			<script type="module">
  import {getCLS, getFID, getLCP} from 'https://unpkg.com/web-vitals?module';

  getCLS(console.log);
  getFID(console.log);
  getLCP(console.log);
</script>
For detailed instructions, you can check the README.
The simplest way by far is using the Web Vitals Chrome extension, which measures the Core Web Vitals, providing instant feedback on loading, interactivity, and layout shift metrics. For this you will need to enable the Web Vitals extension along with console logging in the extension options.
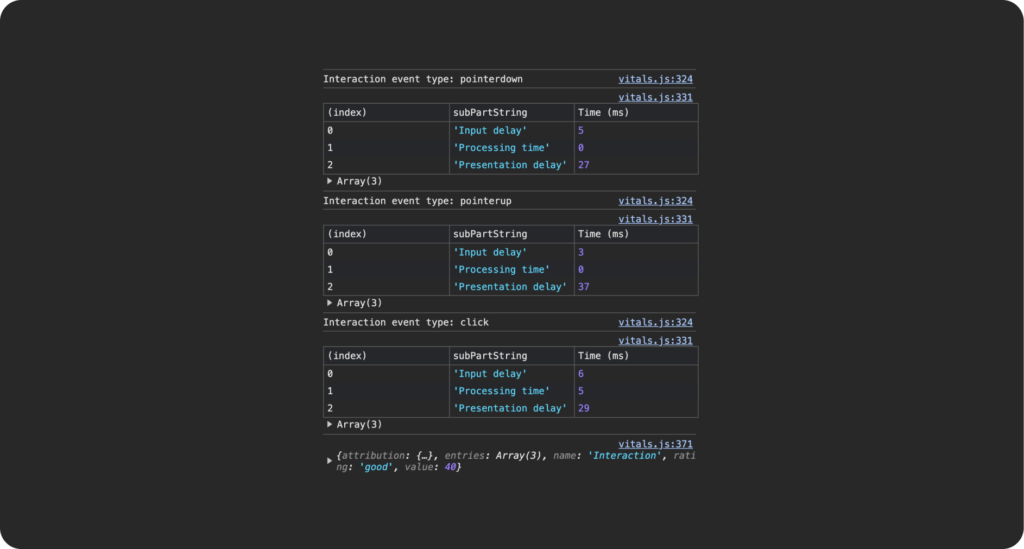
Developers can directly measure these metrics from the developer tools of the Chrome browser.
Web Performance Tooling – Google I/O 2016
Another great resource to learn how to measure the performance of the website and how to analyze each of the metrics.
Find out top devices for web optimization
Find out which devices are most commonly used and generate the highest traffic on the website.
If the website is older, live, and connected to Google Analytics, you can easily access this information directly from its analytics reports.
